Tony Gee measurements
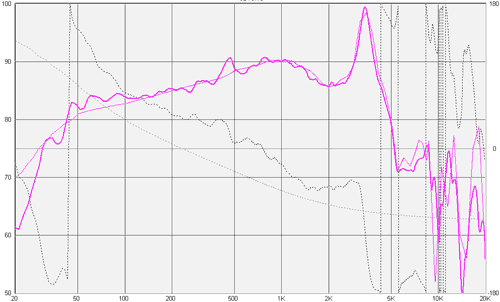
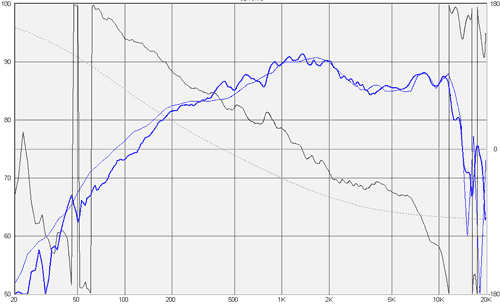
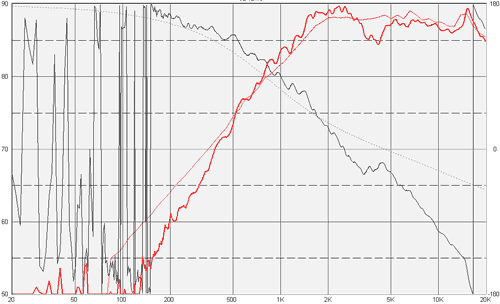
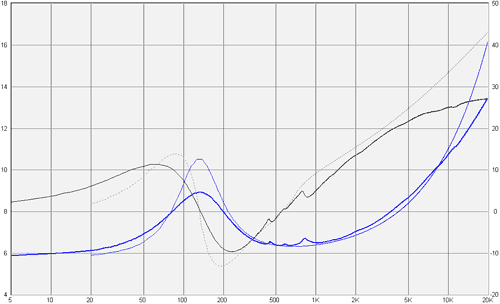
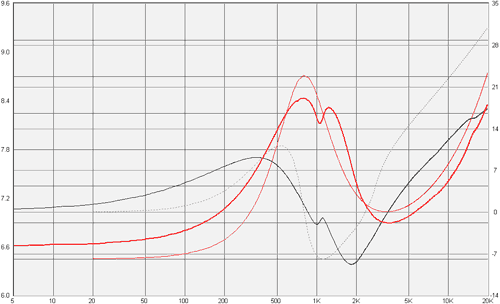
Tony's curves have been measured at 2m distance. Below 200Hz, the curves have been derived from the Thiel-Small parameters of the units. The differences with the anechoic curves are visualized by the following figures.Magnitude:
- Bold colored curve is anechoic amplitude.
- Normal colored curve is Tony's amplitude.
- Black line is anechoic acoustic phase.
- Dotted line is Tony's acoustic phase.
Impedance:
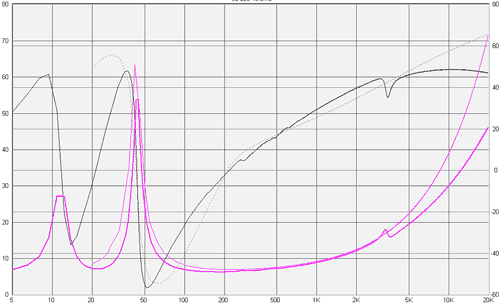
- Bold colored curve is "anechoic" impedance.
- Normal colored curve is Tony's impedance.
- Black line is "anechoic" electric phase.
- Dotted line is Tony's electric phase.
Filters
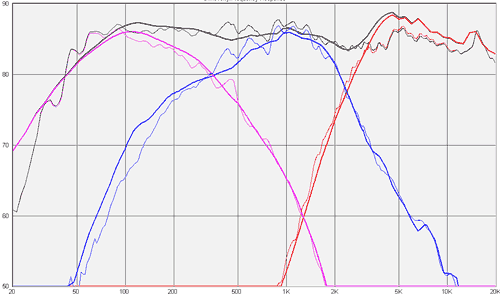
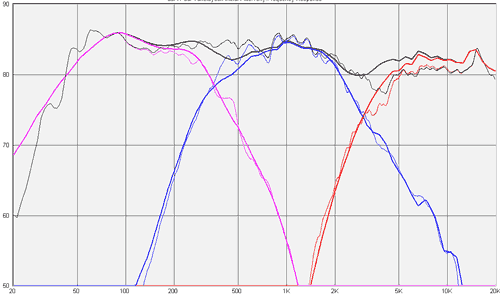
- Bold curves are based on Tony's measurements.
- Normal curves are based on anechoic measurements.
Okke filter:
Paul filter:
Conclusions
Though the magnitude of the units is quite accurate (with an amplitude offset for the tweeter), the phase curves are quite different. From the impedance curves, it is obvious that the Milestones have a bit more dampening. The simulated filter curves show some deviations due to these differences. Especially in filters where phase plays a big role, or when the curves overlap over a large range, quite large deviations may occur (e.g. as shown with some series filters).next->