Rob Dingen measurements
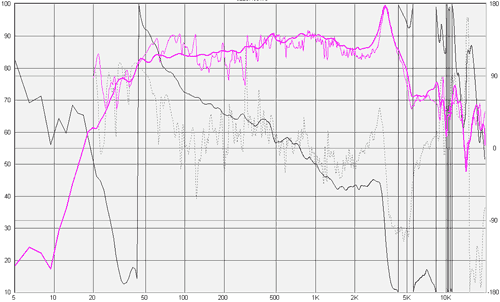
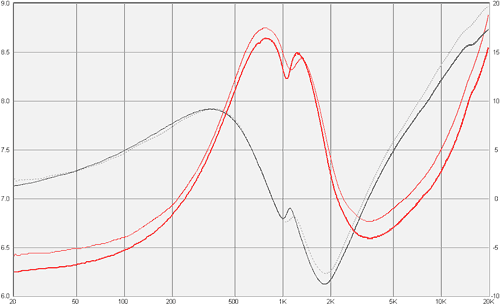
Rob has measured the curves at roughly 50cm distance, each unit measured at the unit height. The measurements of Rob only contain magnitude information. The phase has been added afterwards by calculations (e.g. with Minimum Phase Response Modeler from the frd consortium).Magnitude:
- Bold colored curve is anechoic amplitude.
- Normal colored curve is Rob's amplitude.
- Black line is anechoic acoustic phase.
- Dotted line is Rob's acoustic phase.
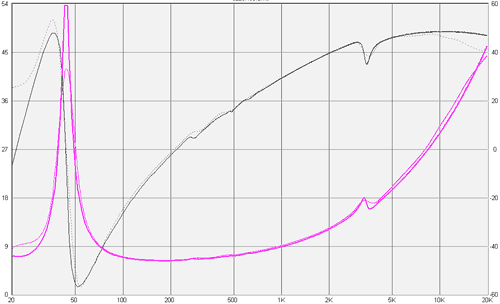
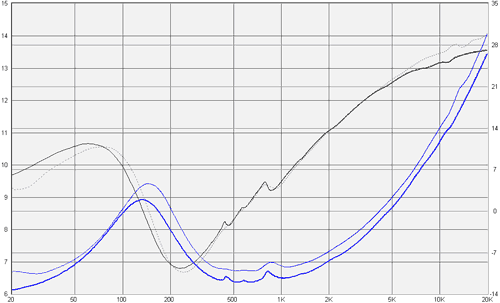
Impedance:
- Bold colored curve is "anechoic" impedance.
- Normal colored curve is Rob's impedance.
- Black line is "anechoic" electric phase.
- Dotted line is Rob's electric phase.
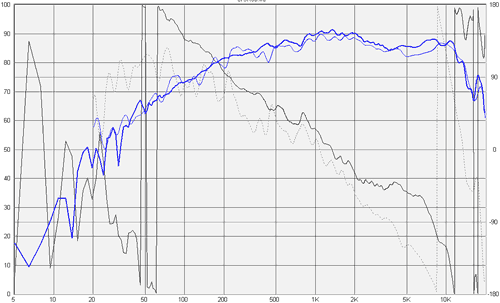
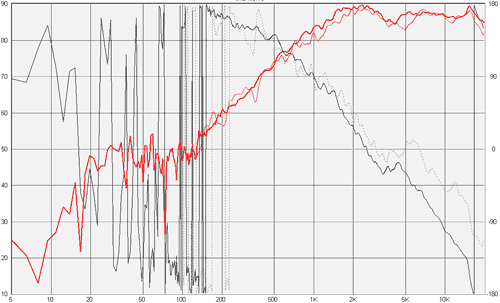
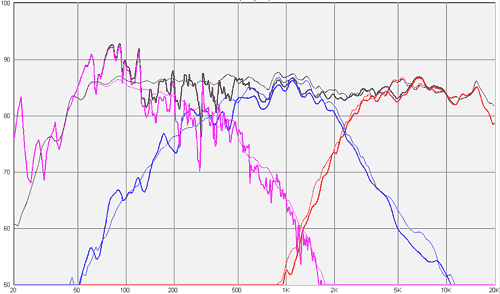
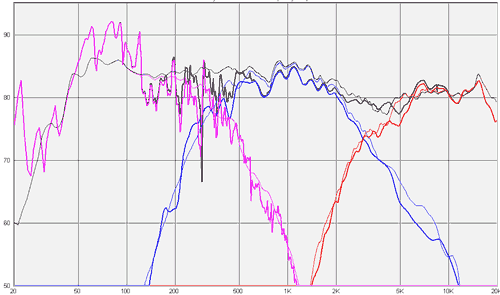
Filters
- Bold curves are based on Rob's measurements.
- Normal curves are based on anechoic measurements.
Okke filter:
Paul filter:
Conclusions
As can be seen, Rob's curves are quite close to the anechoic curves. The phase of the tweeter and midrange have a slight offset compared to eachother, probably due to the measurement distance differences. The main deviations are below 100Hz, and around 5kHz. There is a slight offset at the maximum impedance, and below 200Hz and above 2kHz the (calculated) phase starts to deviate. The filter simulations are pretty accurate, and suitable for filter design.next->