Marc Heijligers measurements
These curves are measured at unit altitude with a 50cm distance from the woofer. The microphone standard kept at the same position for the other units, only the altitude of the microphone has been changed. This implies that the measurement distance for the midrange unit and tweeter slightly increases. My room acoustics cause quite some reflections, so dips and peaks are expected in the curves.Magnitude:
- Bold colored curve is anechoic amplitude.
- Normal colored curve is Marc's amplitude.
- Black line is anechoic acoustic phase.
- Dotted line is Marc's acoustic phase.
Filters
- Bold curves are based on Marc's measurements.
- Normal curves are based on anechoic measurements.
Okke filter:
Paul filter:
Conclusion
It is obvious that my curves contain some serious flaws (of which I was aware). The offset in the phase is explainable by the difference in relative measurement, causing the dip in the filters to occur at another position. The peaking of the woofer at 60Hz is a question mark for me.Nearfield
Measurements I've also performed some nearfield measurements, to see the effect of the baffle and diffractions. The following figures show the nearfield measurements (bold) compared to the anechoic meausurements. The nearfield measurements have been corrected for magnitude, to make comparison easier.The nearfield measurements are limited in their frequency range. For small wave lenghts, the waves may arriv to the microphone at different phases, originating from different parts of the cone. The cone should act as a genuine pistone, and therefore Lmax > Pi . r, or fmax < 344 / (Pi . r), or fmax < 10950 / rcm, with rcm the cone
The length of the contour of the unit must be smaller than the maximal measurable wave length, hence Lmax > Pi . d, with d the diameter of the conus. Hence fmax < 344 / (Pi . d). For the C^2 12 (d = 25mm) this implies fmax < 4.3kHz. Due to the fact that the grill in front of the units prevent a genuine near-field measurement, the actual frequency will be a bit higher, and one can indeed see a decrease of the repsonse beyond the 10kHz. For the C^2 79 (d = 9cm) we find 1.2kHz, and for the C^2 220 (d = 17.2cm) we find 637Hz.
With a program called the Edge, one can approximate the effects of the baffle step. I've modeled the front baffle only, and applied the baffle step correction in Speaker Workshop by combining the nearfield and baffle step response, and compensatee 0.5dB to match the magnitude on the midrange again. The resulting curve is dashed.
As can be seen, the response matches the anechoic response quite nicely, with a slight bump around 50Hz, and a peak at 300Hz (when I measured the nearfield response, I've applied little dampening only).
Measurement Setup
The microphone used for measurements is a Behringer ECM8000.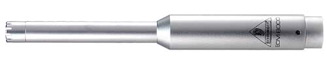
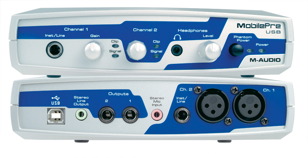
I use a combined microphone/sound-card of M-audio, the MobilePre. It connects via USB to the computer (in my case an Apple iBook). To be honest, I wished I never bought this device. If I connect this device to the Mac a second time, it crashes(!!!) my iBook. My iBook normally has uptimes in the order of months, but this device obviously has a USB driver to decrease latency, but in such a way that it messes with the UNIX kernel. Unacceptable! Secondly, when Apple releases a new OS, the device becomes unusable for a few months, until a new driver is released by M-Audio. Last but not least, impedance measurements via its line input are impossible. Some unexplained significant raise of impedance pops up when trying to do these type of measurements. M-audio support hasn't reacted at all on my messages. So my recommendation: stay away from it! The only positive thing is that when keeping the gain of the microphone inputs at a moderate level, it has a good acoustic response for speaker measurements.
To perform the measurements, I’m using FuzzMeasure on my Apple iBook. It is user-friendly software, that is true plug-and-play. Starting-up, connect the MobilePre, and after a few seconds the first measurements are there!! Highly recommended, my PC-friends even say they have a good reason to switch from a PC to a Mac because of this program! :)
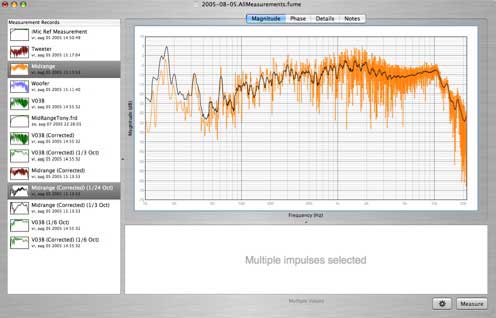
Measurements can be done by using MLS, pink MLS, or frequency sweeps. The program allows simultaneous display of different measurements by selecting them in the left pane. Curves can be subtracted for compensating for deviations in the measurement equipment, and processed with different FFT windows and smoothing. Curves can be compared immediately by selecting measurements simultaneously in the side-bar. I haven’t calibrated the setup yet, so I can only perform relative measurements, which is sufficient for speaker design.
next->